Have you ever been on a client call where you have proudly
presented your data and gave what you thought was an insightful recommendation?
Only to find out that your data was based on wrong suppositions.
If you have, you must understand how uncomfortable
the situation is.
Starting conditions
Recently, I set out to determine the best options for
Retail Pre-VIP and VIP flows for one of our clients.
In order to do that, I used the segmentation features available
in the client’s ESP (Email Service Provider for those who are not in the
marketing business). As there are three separate lists, out of which two are retail
lists and one is wholesale, I needed to focus only on the two Retail ones.
One of the conditions I originally set up was that the customer
belongs to one of the two Retail lists. Then, I determined the average customer
values in order to get a baseline I could use for comparison. The next steps
included further segmenting and fine-tuning until I had reached the ideal 3-5%
of customers and had some numbers to go along with that. IMPRESSIVE numbers.
Numbers do not lie
But, as it turns out, they can’t tell you that your initial
supposition is wrong.
In my case, the spreadsheet could not tell me that the data
included some customers that were in the Wholesale list. How so? Well, people
can belong to more lists… The client informed us during the call that some of
the wholesale accounts also belonged to retail lists.
So, I needed to redo the segmentation and present the
updated findings to the client. The impressive numbers became, well, not so
impressive numbers and the whole recommendation strategy had to change.
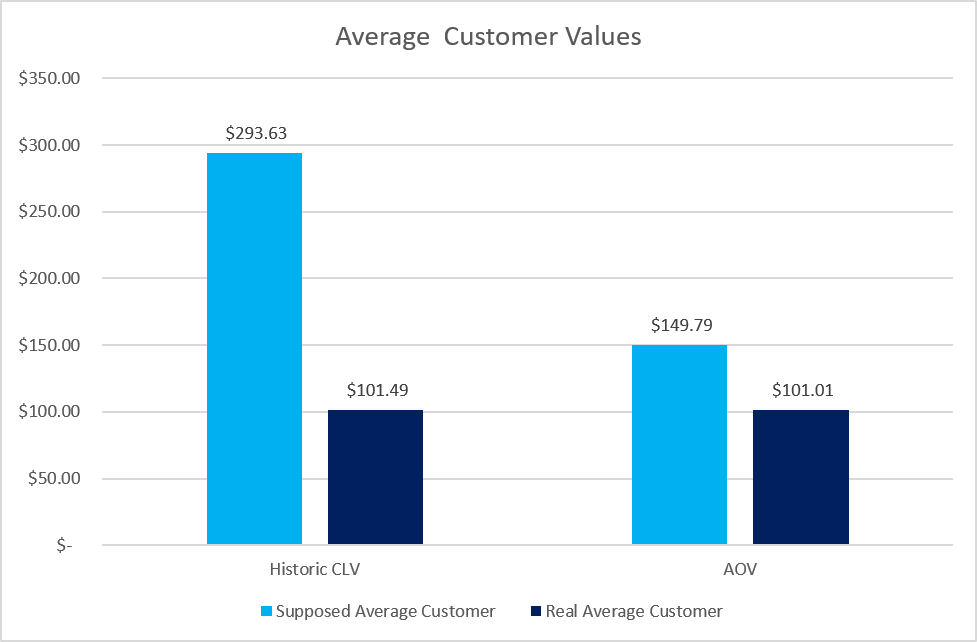
While this didn’t radically change in regard to the actual
number of customers that served as a baseline, other values, such as CLV
(Customer Lifetime Value) and AOV (Average Order Value) did.
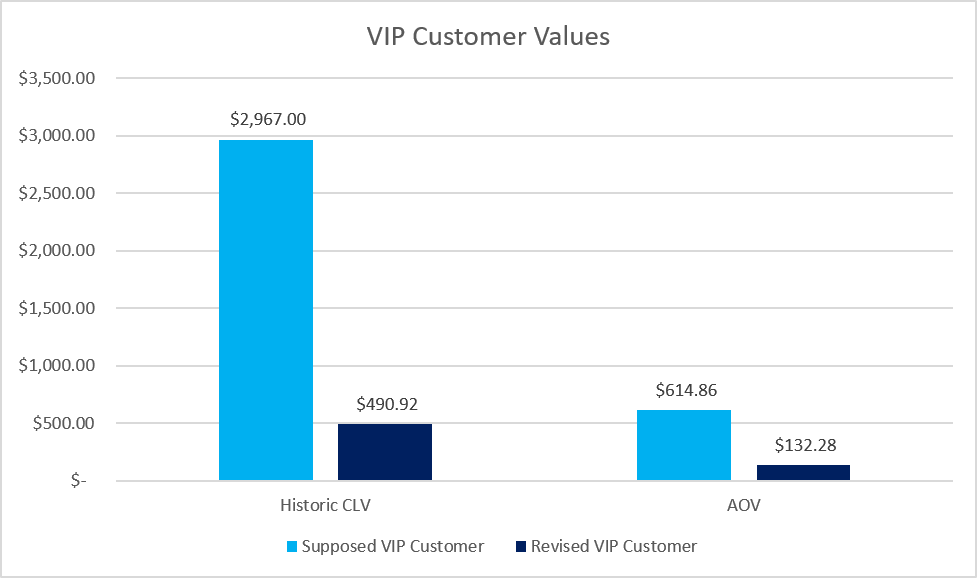
And the numbers for the VIP customers changed dramatically.
Here is the overview of some of the differences (numbers
have been altered as to represent the actual ratio but not the actual HSLV and
AOV):
Poka Yoke
One small condition, right?
HUGE DIFFERENCE.
We have been talking about poka yoke (mistake-proofing) at
work and how we should approach doing tasks. It is a great concept and it is
showing results.
I think that, in my case, I should have also applied it to
how I THOUGHT about things. If I wanted to include A and B, but not have C, the
smart approach would have been to add one tiny condition saying: “exclude C”.
It looks obvious now, but it was not when I started doing my task.
A good way to prevent these kinds of situations is to think
carefully about the conditions you want to use to segment your target group and
what they might imply, and then think some more. Only then can you start
compiling data and doing your analysis. This will help you mistake-proof your
findings and present data-based recommendations.
Remember, spreadsheets do not
make mistakes, but we do, so we need to approach each date analysis task thinking about
how we can mistake-proof the initial data. If the numbers are not so impressive…Well,
…
Comments
Post a Comment